SmartVision BI - Intelligent Data Analysis, Visualizing the Future
One-stop Enterprise Data Visualization Analysis Platform
One-stop Enterprise Data Visualization Analysis Platform
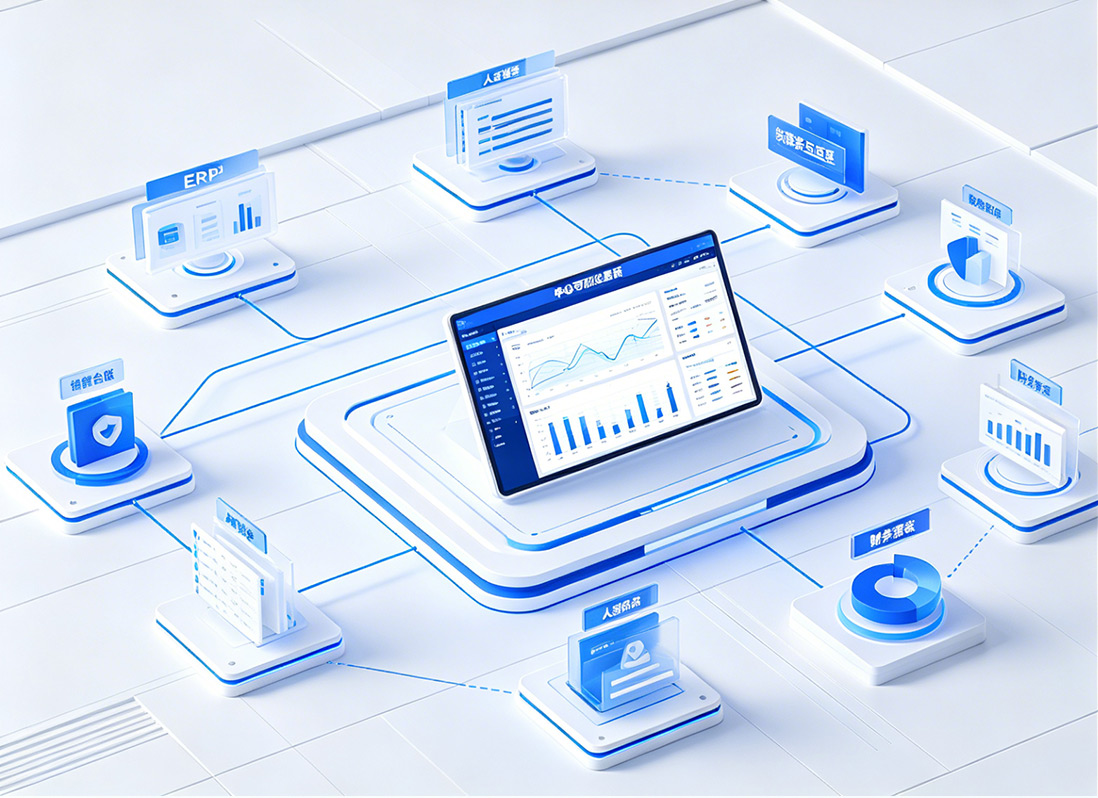
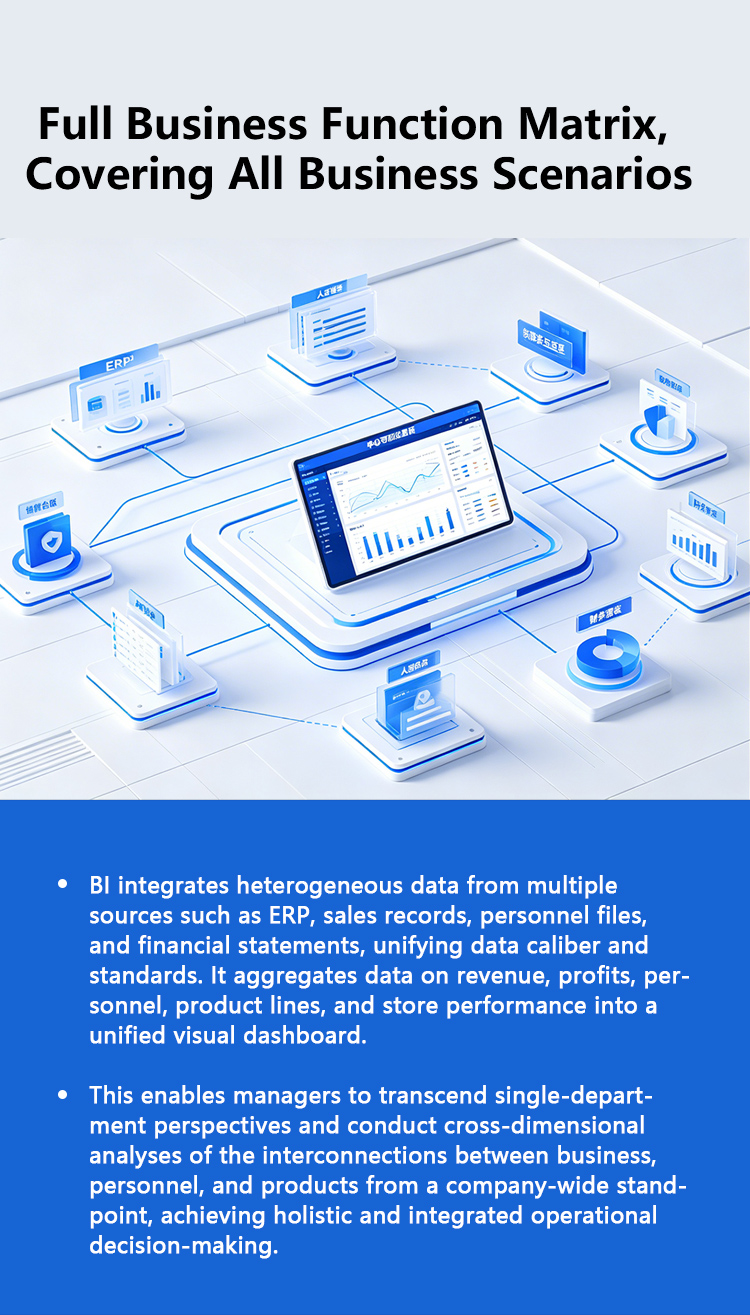
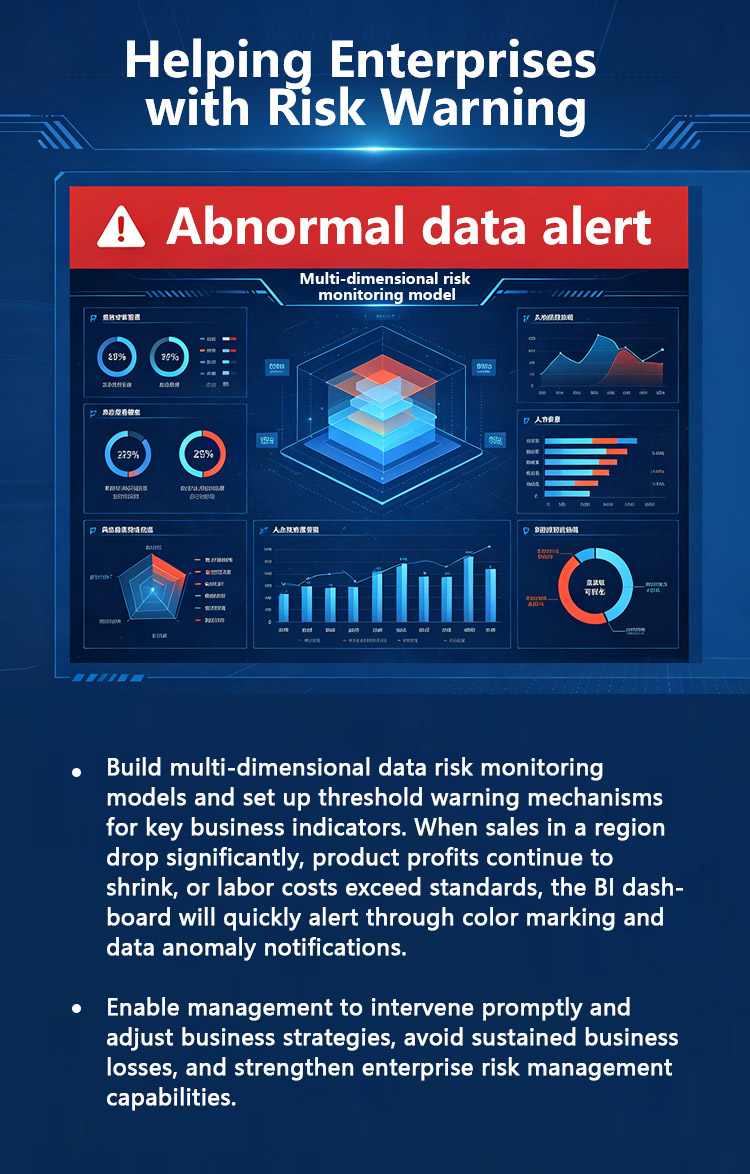
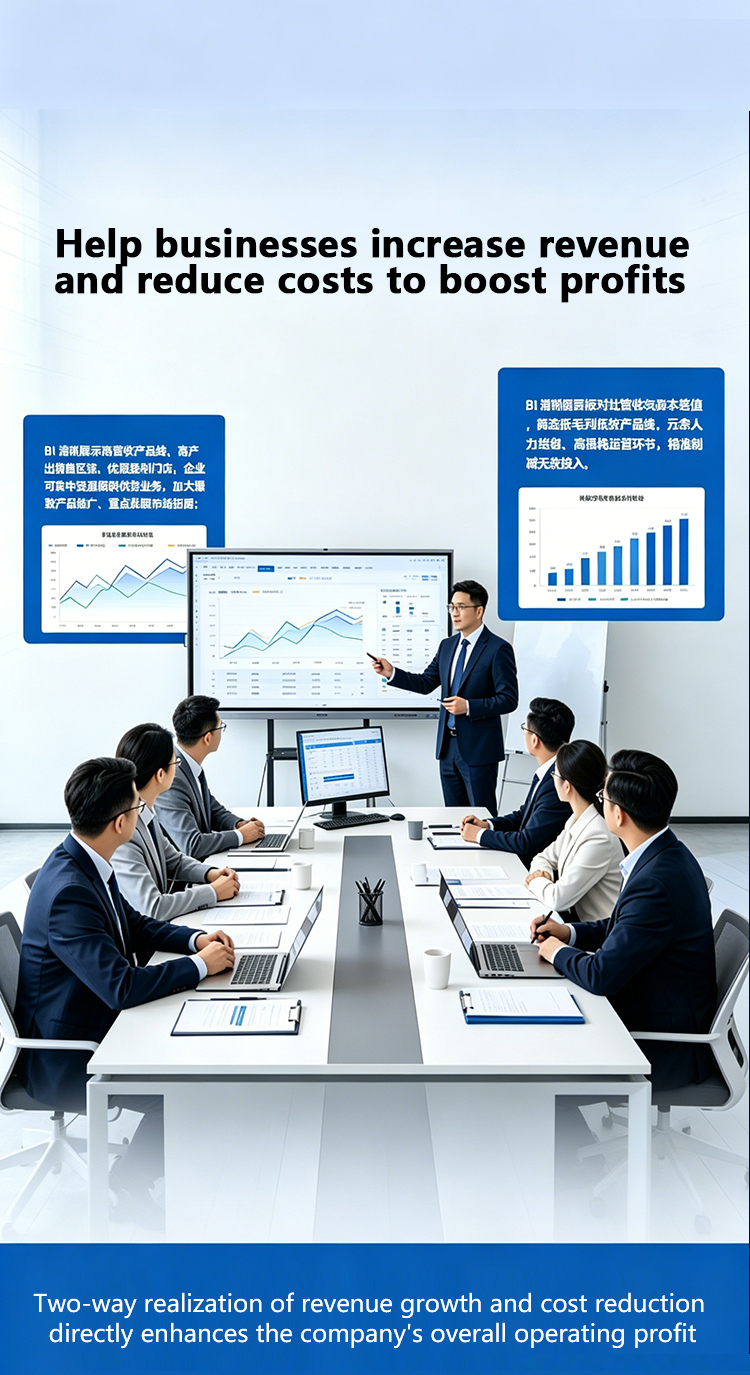
BI integrates heterogeneous data from multiple sources including ERP, sales ledgers, HR files, and financial reports, unifies data metrics and standards, and consolidates revenue, profit, personnel, product lines, and store performance data into a unified visualization dashboard.
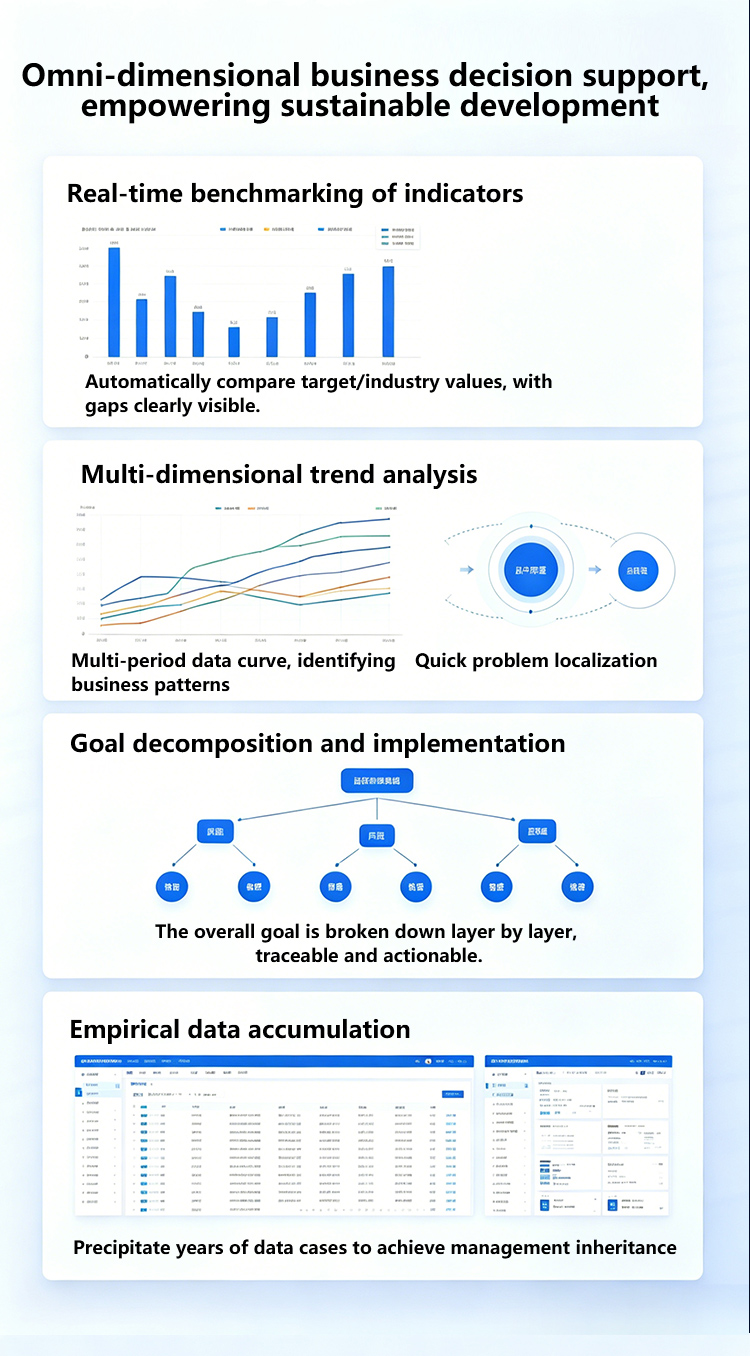
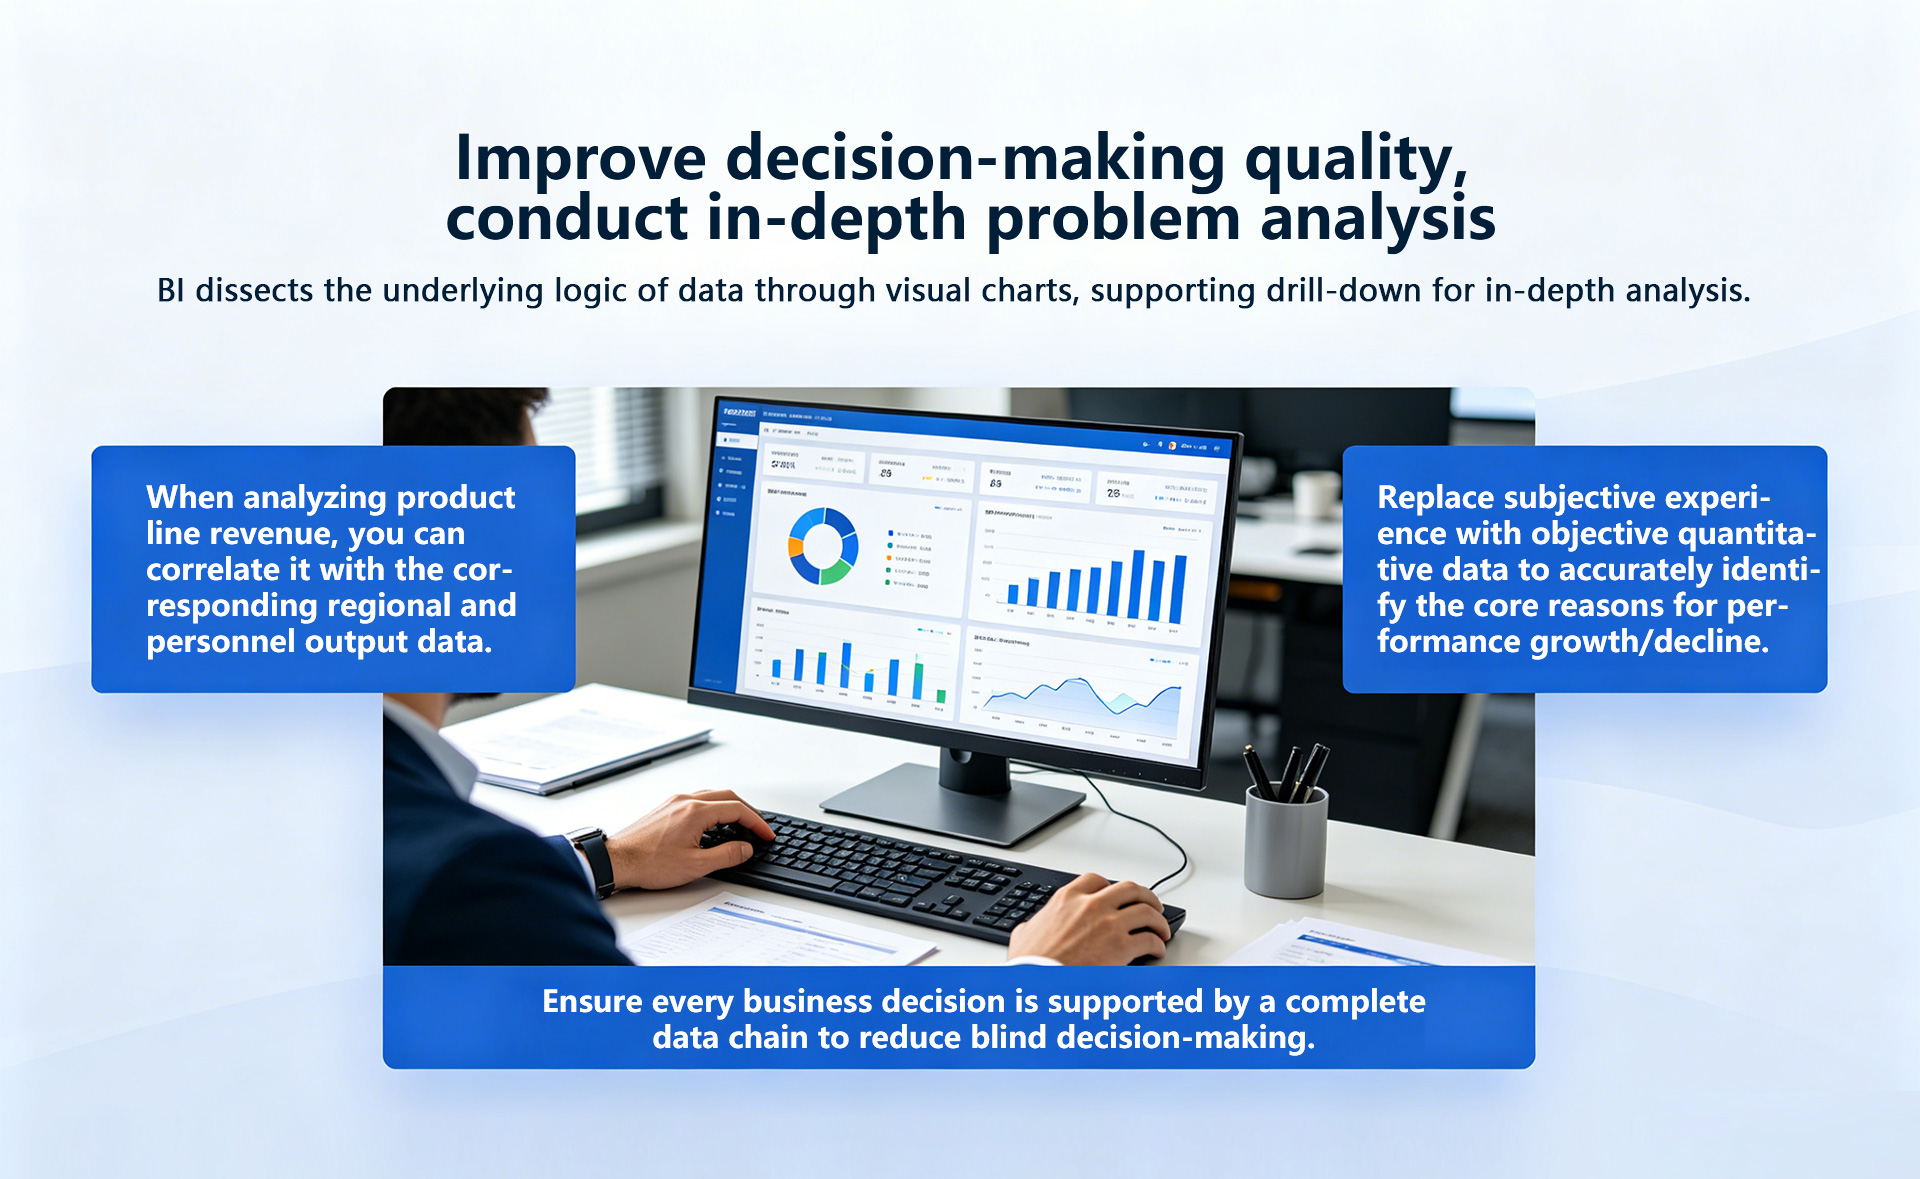
Enables managers to move beyond a single department perspective, analyze the interrelationships between business, personnel, and products from an overall company dimension, and achieve global and integrated business decision-making.
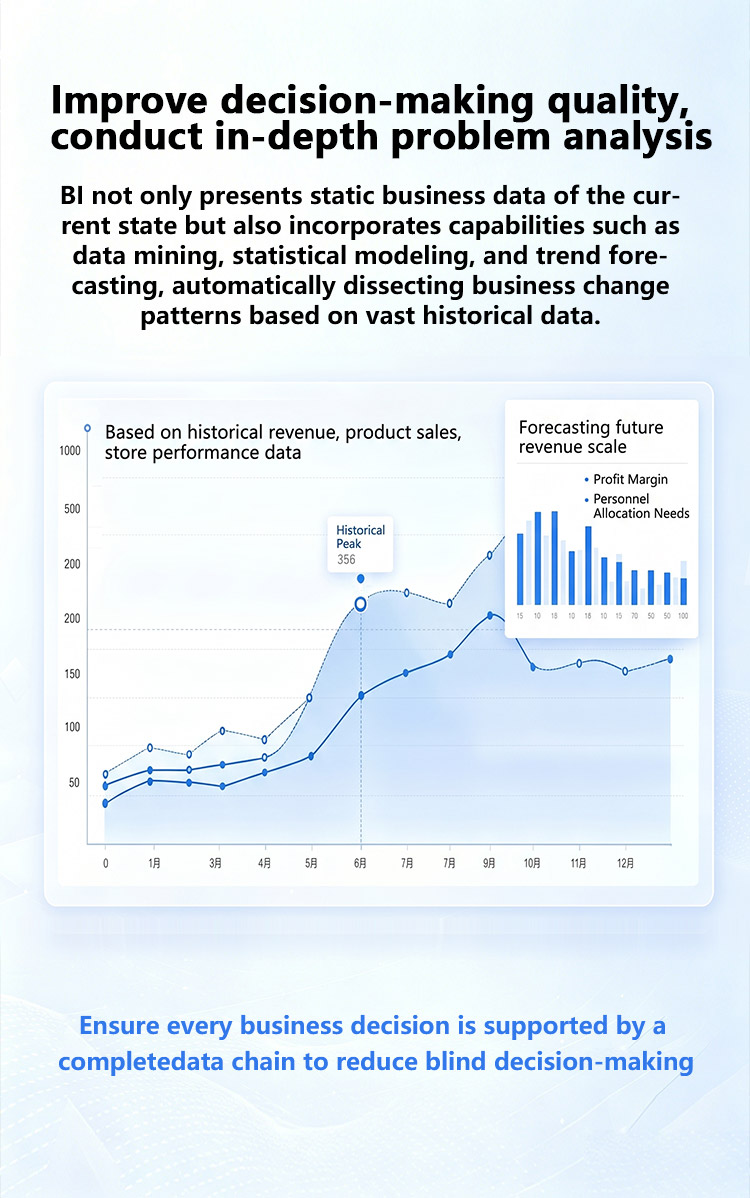
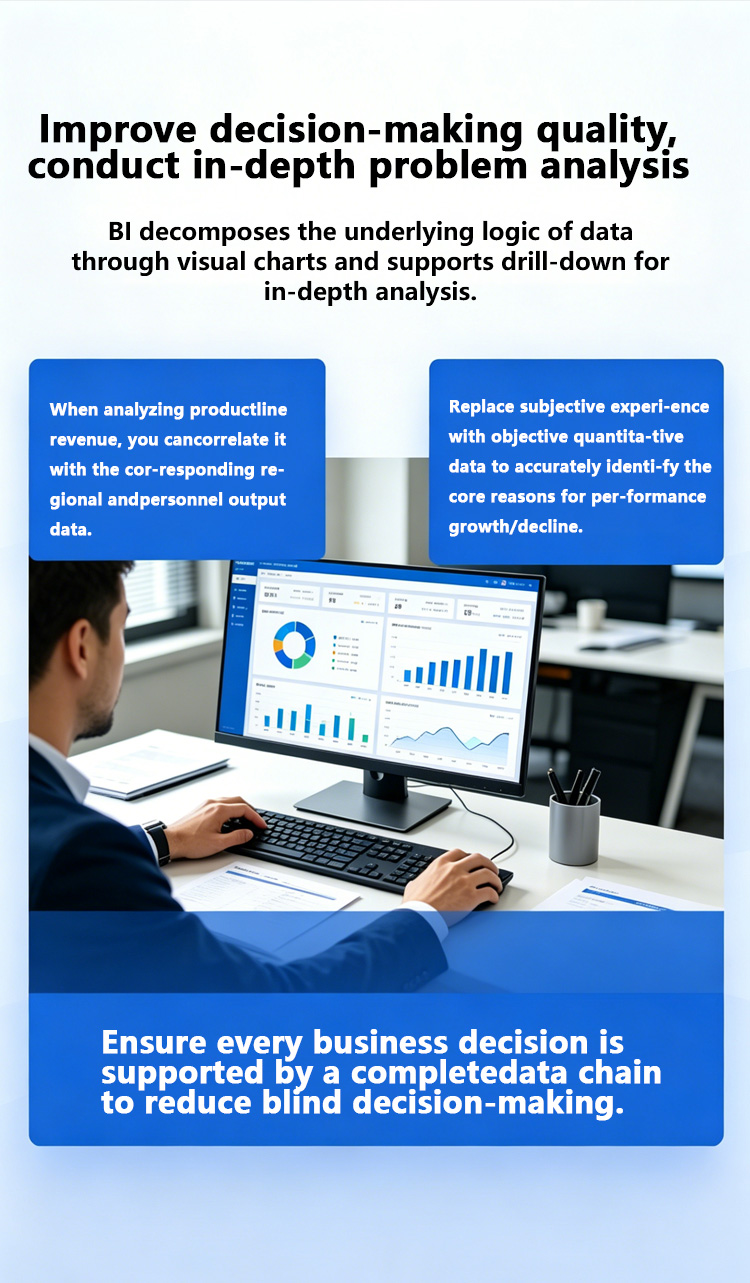
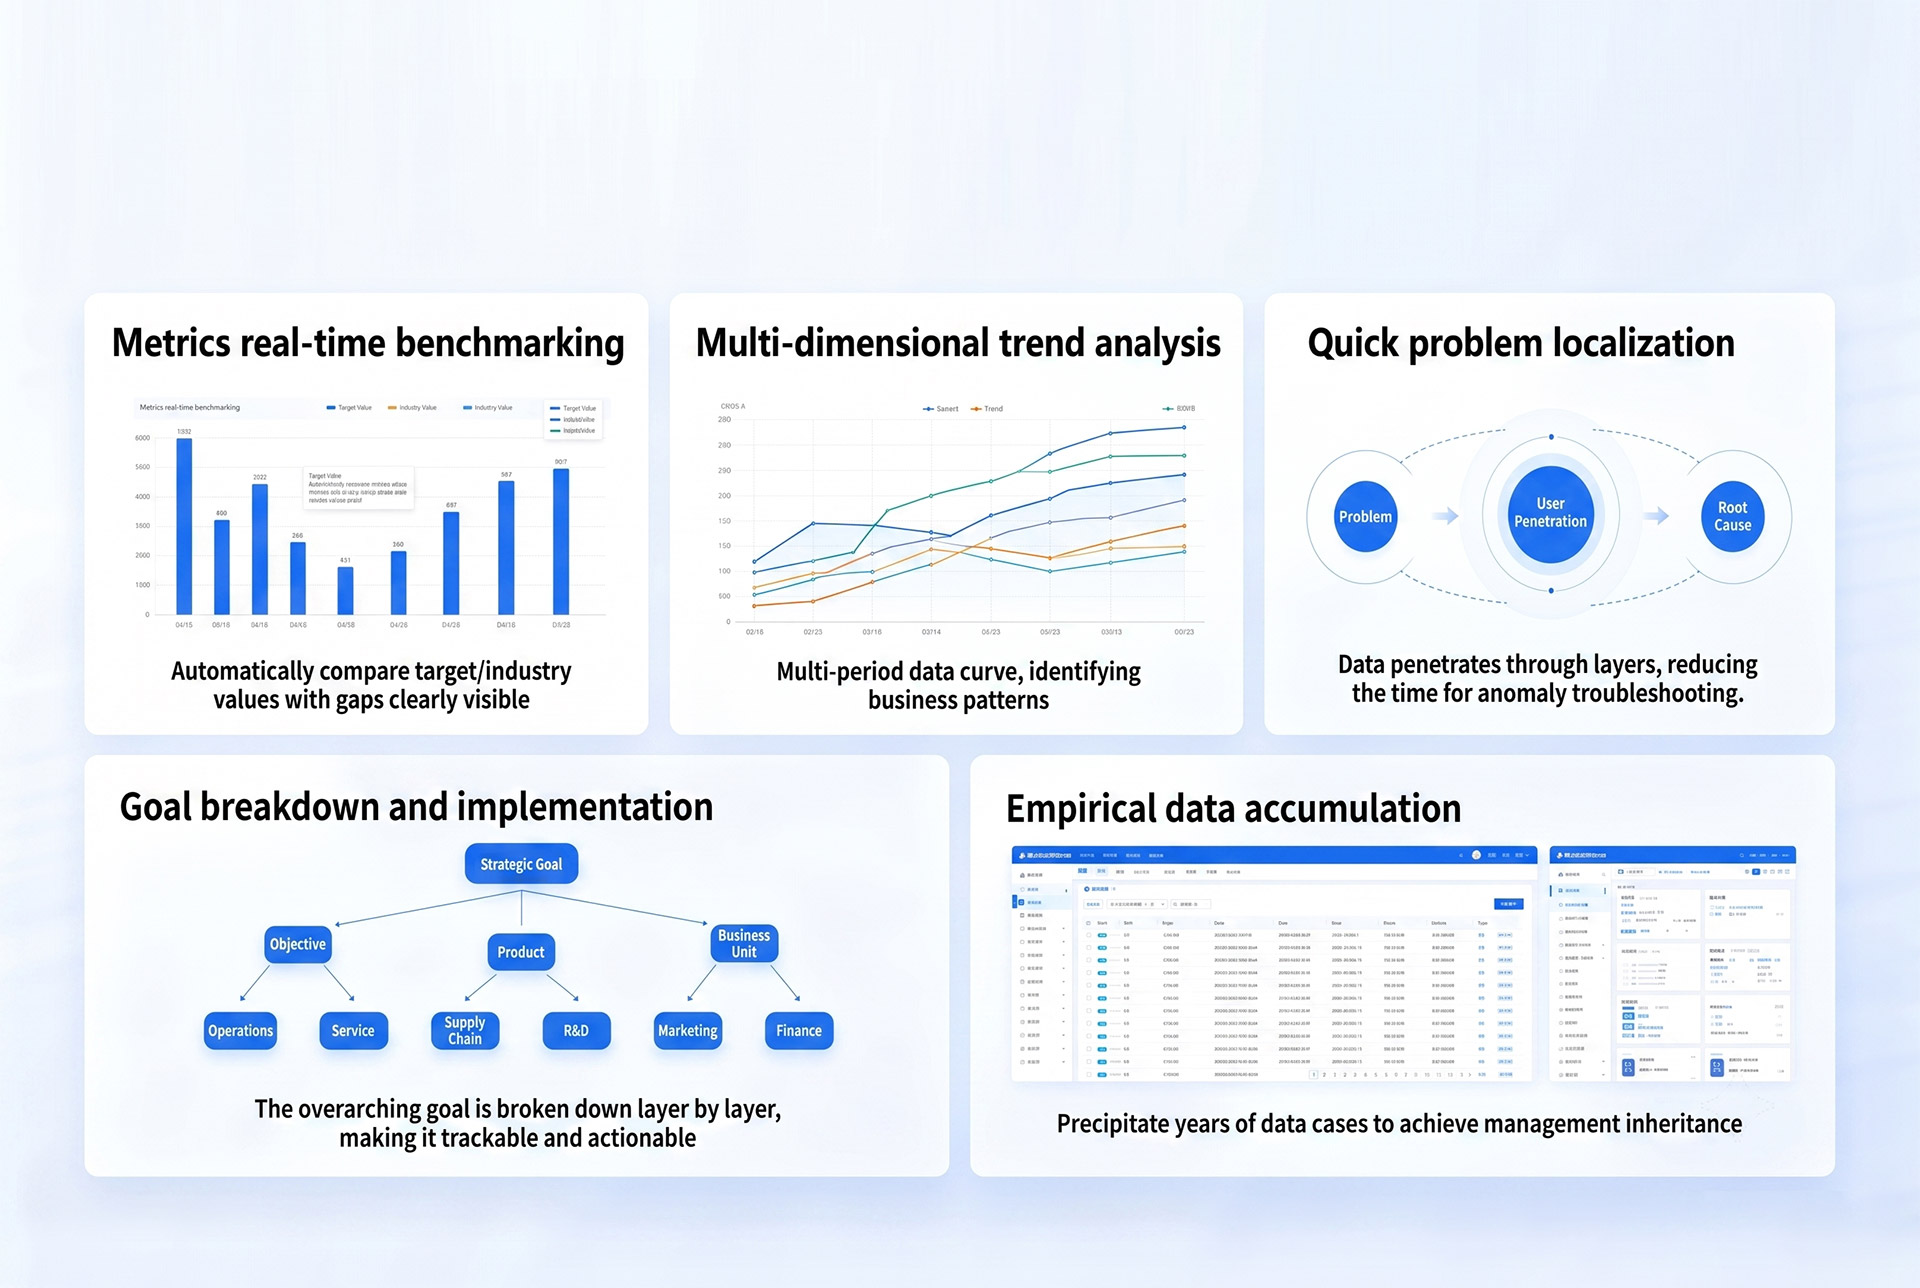
BI not only presents current static business data, but also is equipped with data mining, statistical modeling, and trend forecasting capabilities, automatically analyzing business change patterns based on massive historical data
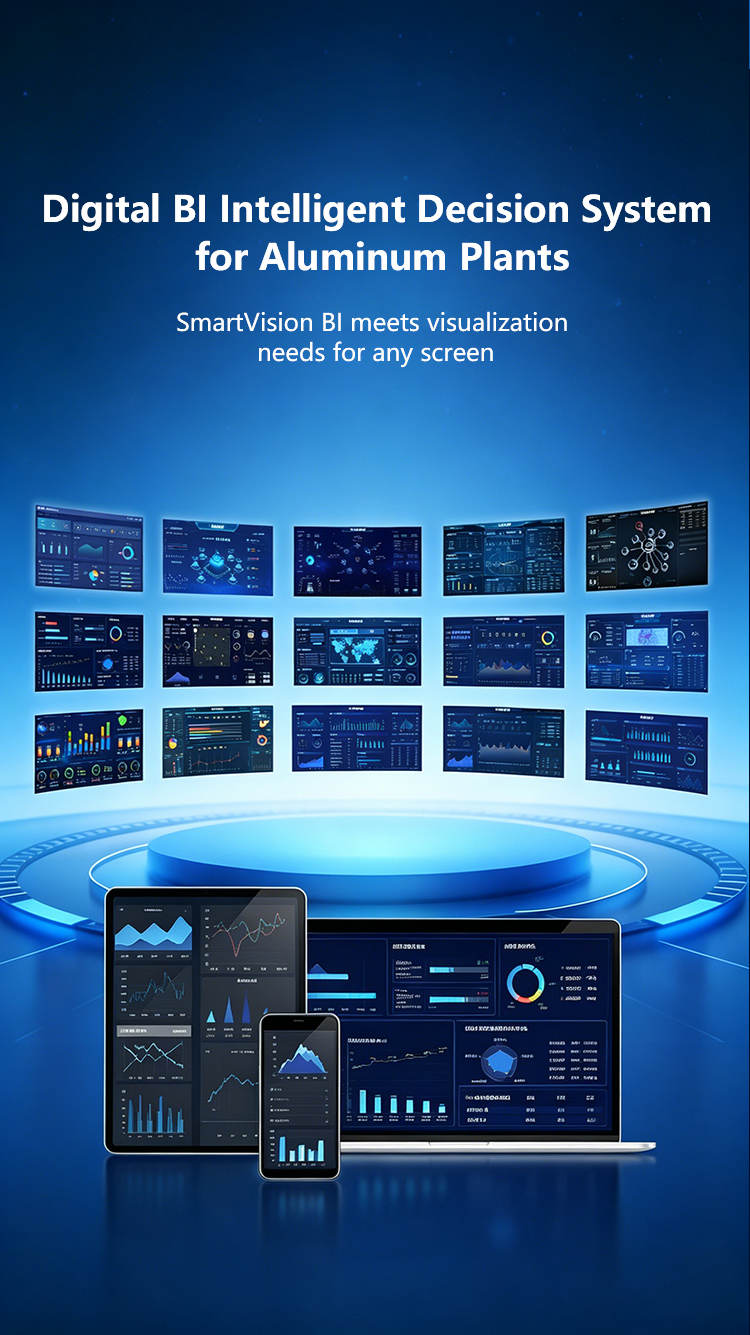
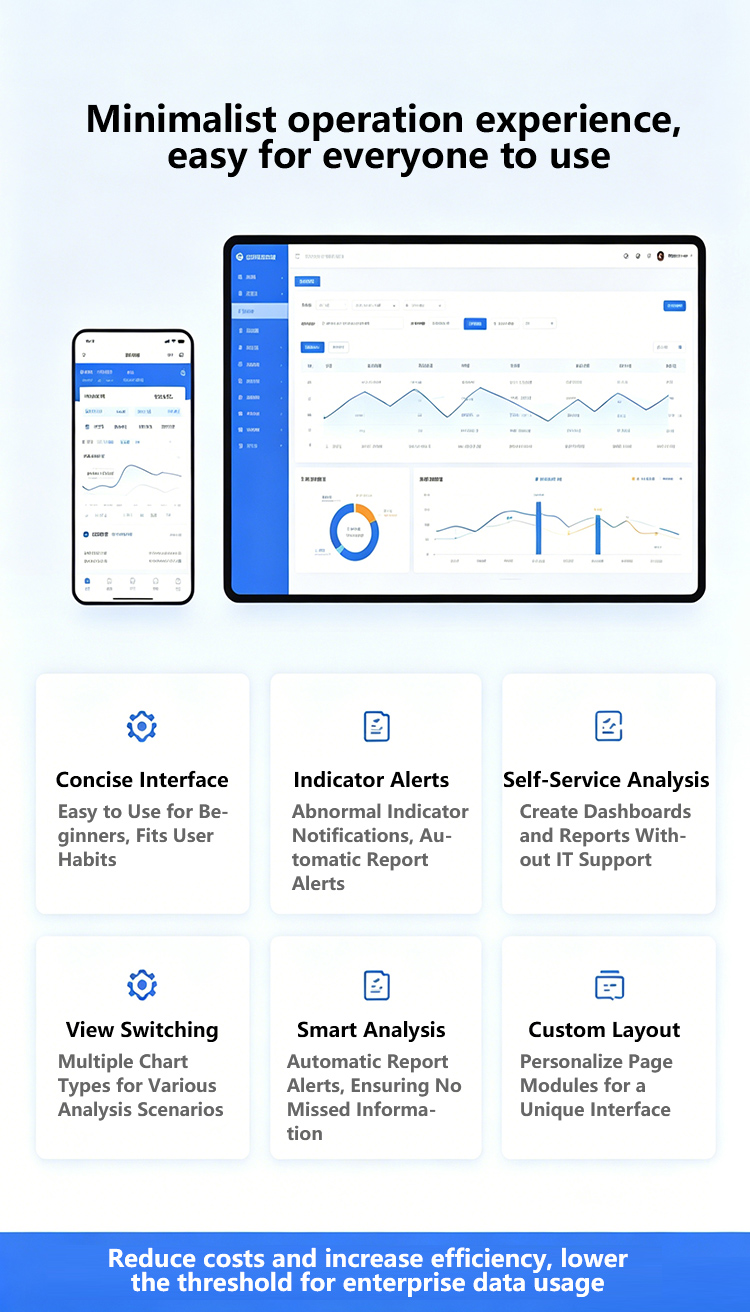
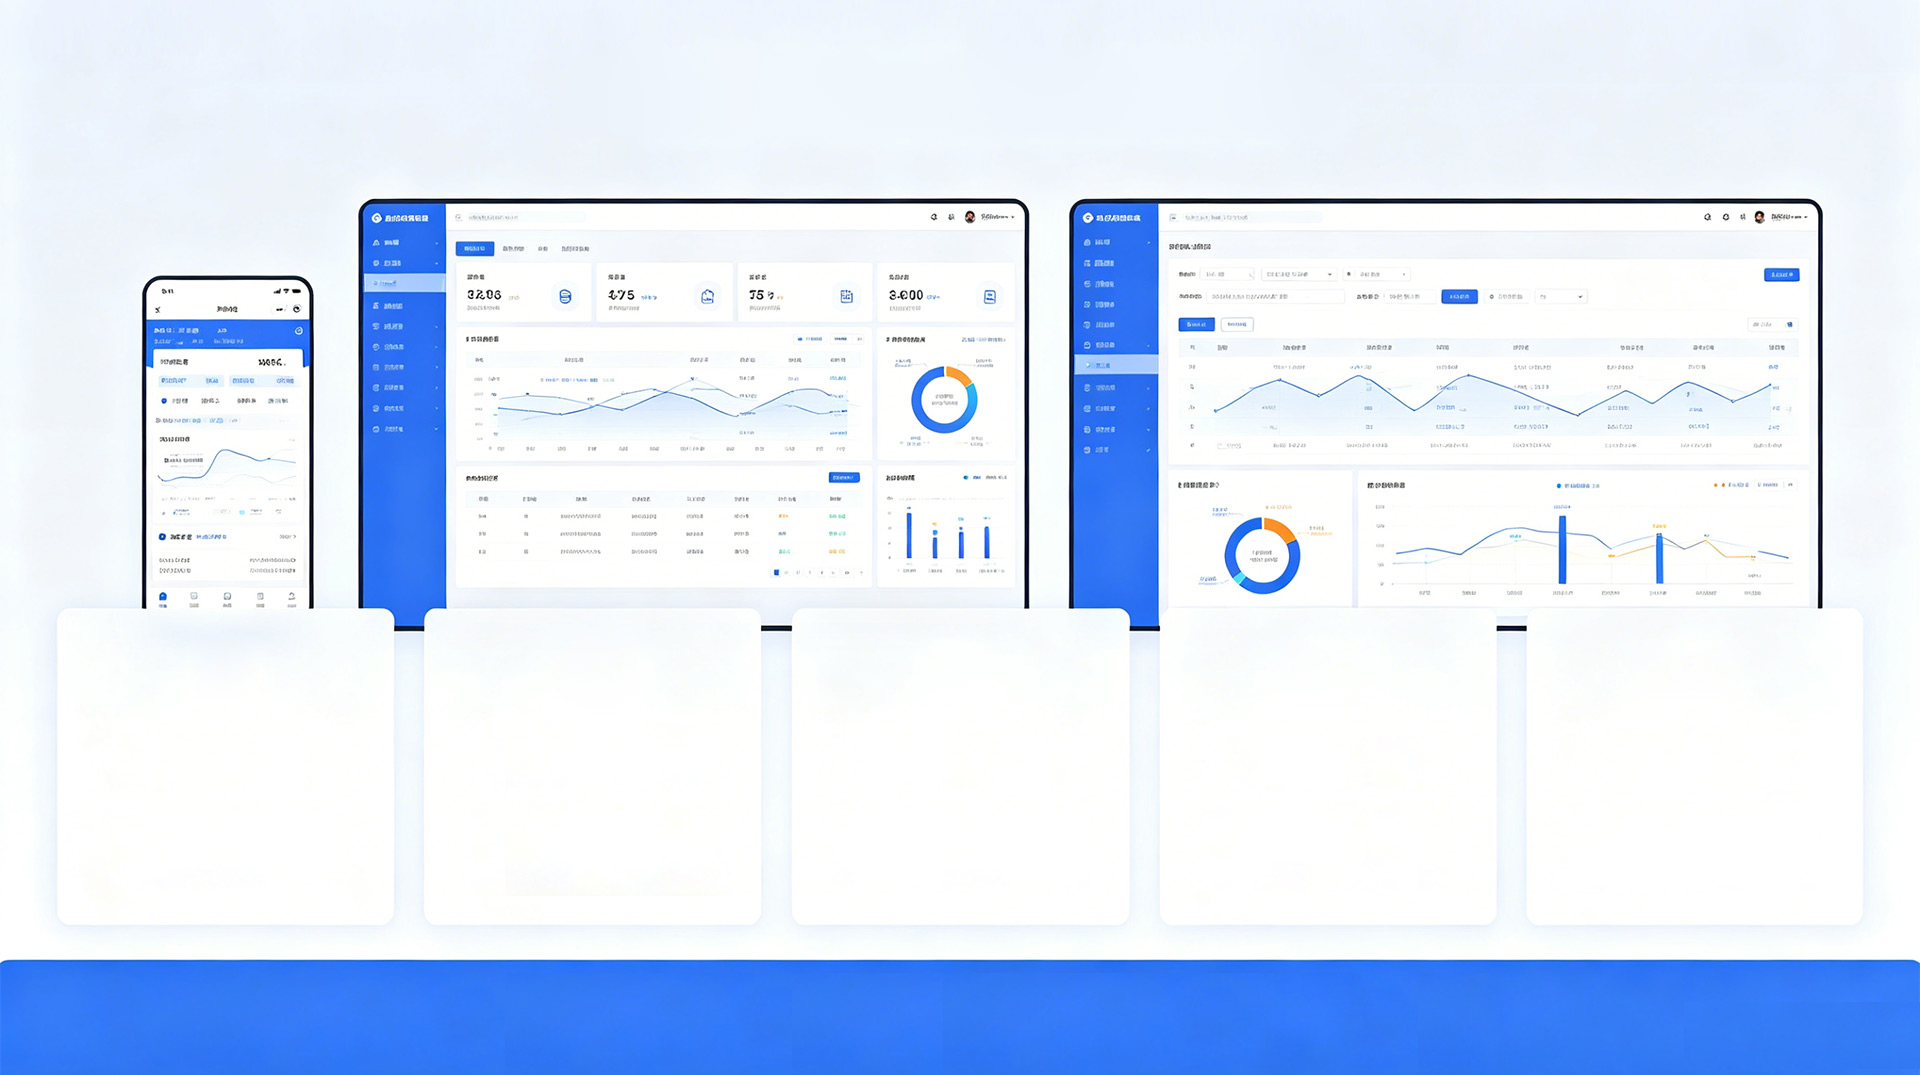
SmartVision BI meets visualization needs for any screen
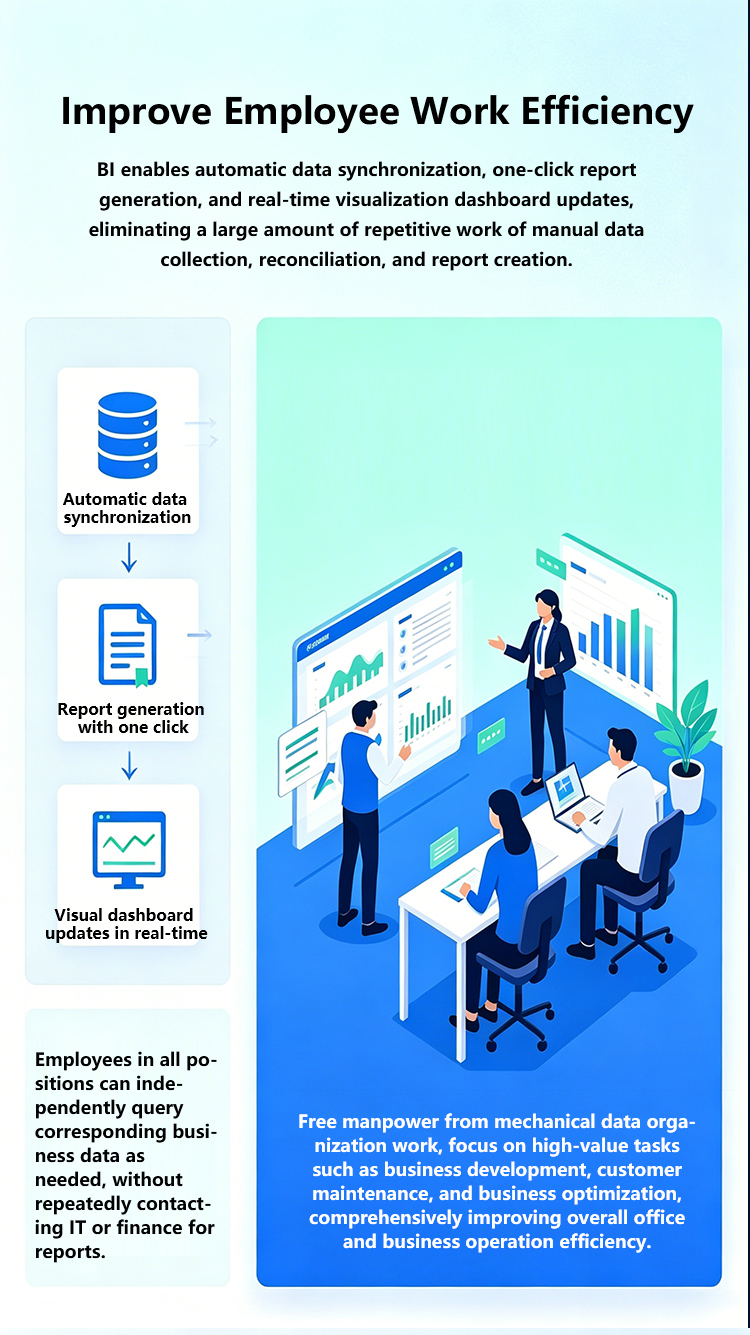
BI enables automatic data synchronization, one-click report generation, and real-time visualization dashboard updates, eliminating a large amount of repetitive work of manual data collection, reconciliation, and report creation.
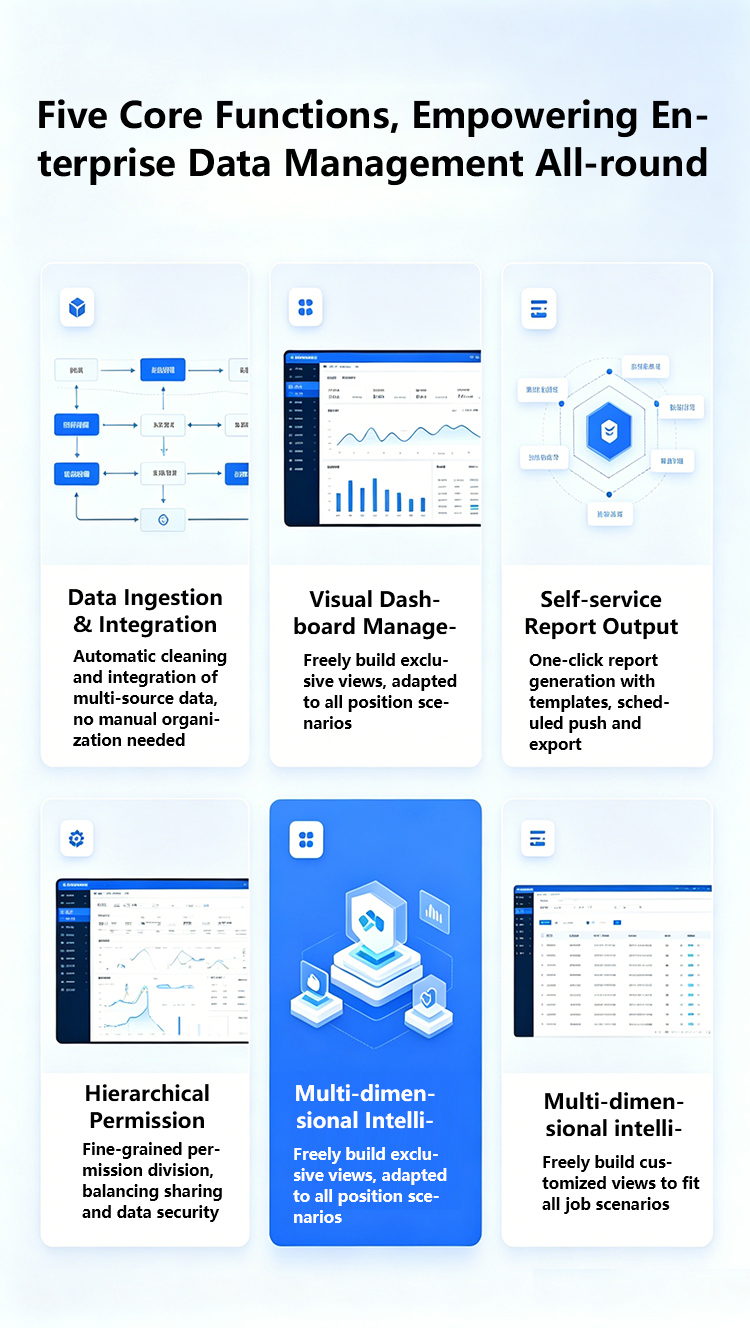
Automatic cleaning and integration of multi-source data, no manual organization needed
Freely build exclusive views, adapted to all position scenarios
YoY/MoM/data drill-down, flexible and comprehensive analysis
One-click report generation with templates, scheduled push and export
Fine-grained permission division, balancing sharing and data security
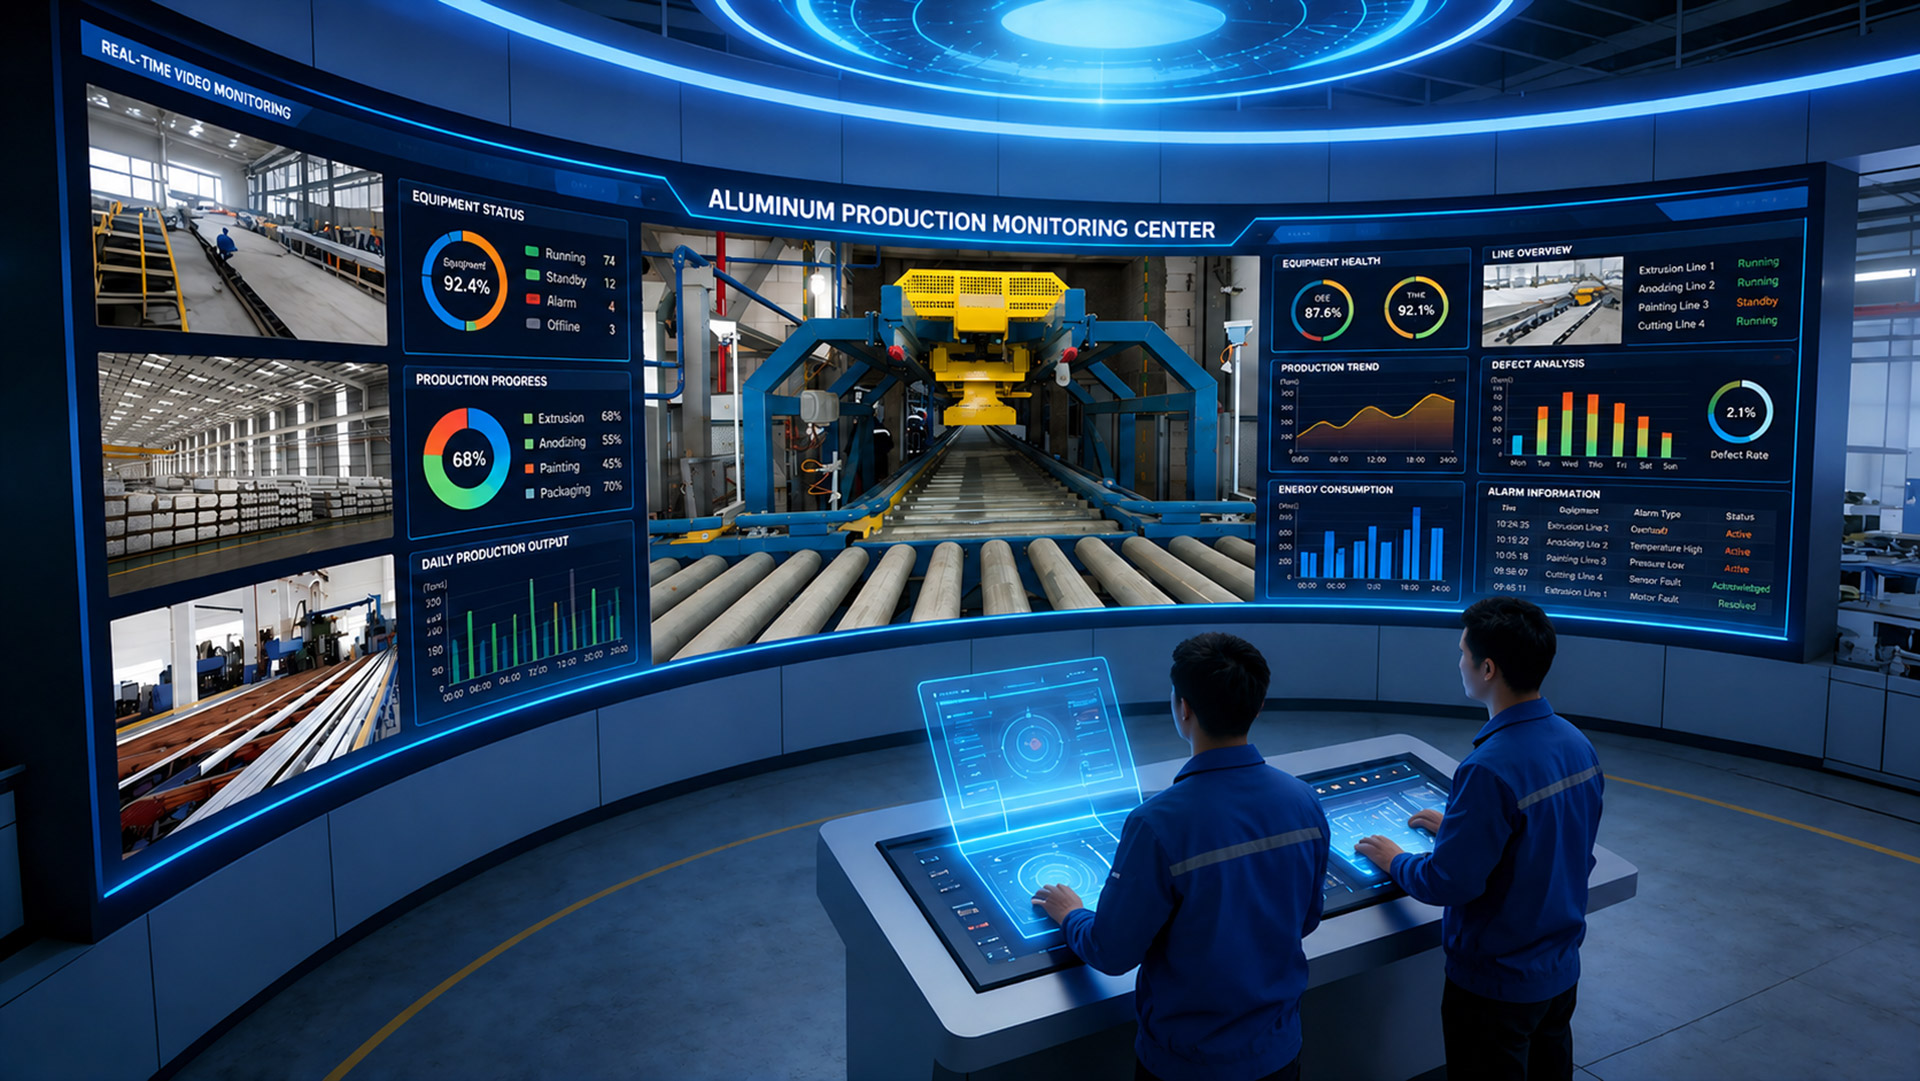
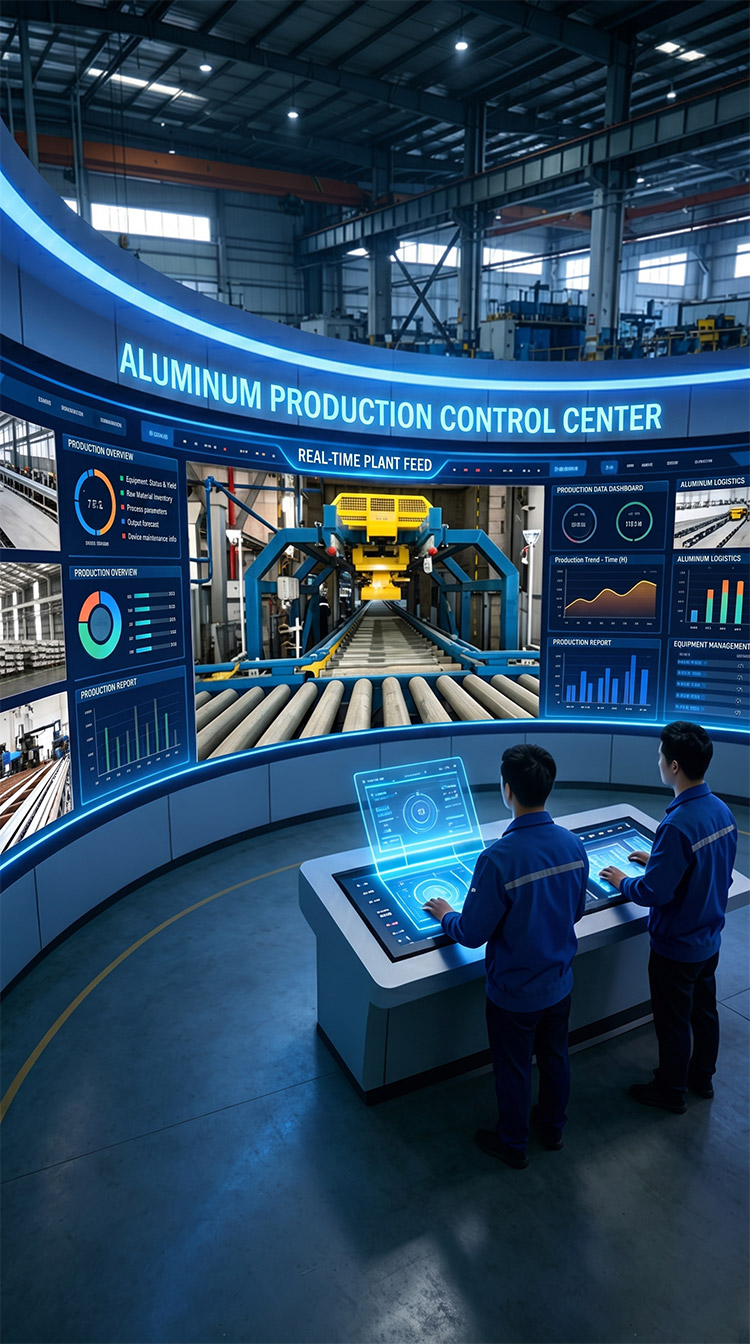
Book a demo now to learn more about digital transformation solutions and bring your enterprise into the era of intelligent manufacturing
© 2026 GuanzhiMei Digital. All Rights Reserved | 粤ICP备15072425号

Scan to add WeChat